INDUSTRY
Built for any facility team, in any sector.
One platform, endless use cases.


How a Large State
Transportation Agency
Modernized Its Facilities
Operations With zLink
A story of strengthening and modernizing the operational
backbone for a statewide facilities network that keeps a state's
transportation system running every day.

2153
Buildings Statewide
775
Properties Managed
3M+
Square Feet Facility Space
6+ Years
Ongoing Partnership

“zLink has become the backbone of how we manage our facilities. zLink replaced paper work orders, IBM TRIRIGA, and iPlan , so now everything from work orders and preventive maintenance to condition assessments and reporting lives in a singular system. That visibility is invaluable.
It allows us to clearly prioritize projects, show leadership whatʼs really happening in our buildings,
and pull the reports we need to build our strongest case for funding."
- State agency’s zLink administrator

Key Outcomes
One source for all facilities data
Statewide reporting
PM visibility for staffing & funding justification
Data-driven project prioritization
Map-based reporting dashboards
Fully digitized work orders
About the agency
This state transportation agency plays a mission-critical role in keeping people, goods, and the economy moving. It manages a vast and diverse infrastructure portfolio, spanning 2,153 buildings across 775 properties and over 3 million square feet of facilities.
These assets include maintenance hubs, rest areas, offices, DMV locations, communication infrastructure, and specialized transportation facilities—each with unique operational needs.
The facilities department is responsible for ensuring these assets remain safe, functional, and reliable, directly impacting millions of residents across the state.

The Challenge
Outdated Systems and Heavy Manual Workloads
Before implementing zLink, the state agency's operations were slowed by fragmented systems and paper-based processes that made it nearly impossible to understand true facility demands.
Antiquated IBM TRIRIGA
Aging system with increasing failure points.
Poor Support from iPlan
Mounting frustration with condition assessment tool.
Paper-Based Work Orders
Every order printed and data manually entered back into system.
No Visibility
No reporting on labor, costs, or building and asset history.
Scattered Data
Siloed data across many software platforms and paper-based processes.
No Drawing Storage
No source of truth for building drawings.

“
Requests used to come in by email,
I entered them into IBM TRIRIGA,
printed every work order
for our maintenance technicians, and then
manually re‑entered all their handwritten data
and updates back into the system.”

State agency’s zLink administrator

Why zLink was chosen
After a rigorous evaluation process, the agency selected zLink for its ability to deliver:

Unified Cloud Platform
Cloud-based implementation built on Microsoft Azure

Real-Time Work Orders

Fully Integrated Modules
Assets, PM, condition assessment, and project tracking in one system

AutoCAD-Integrated Floor Plans
Building drawings linked directly to facility records

Customizable Configuration
Flexible fields, workflows, and reports tailored to their needs

Single Source of Truth
Centralized platform for maintenance, documents, leases & projects

Scalable Solution
A robust architecture designed to accommodate the agency's future growth

White Glove Support
A dedicated team providing hands-on guidance in implementation and beyond
Access to zLink Anywhere
The 10-Step Journey
A highly structured 6-month implementation phase laid the foundation for adoption success


Kick Off Meeting

01

Pilot Data Migration
06
Onsite Requirements Analysis
02
Data Migration & Integration
07
Configurations & Integrations
03
Training
08
Configure SaaS Environment
04
Testing
09
Existing Data
Repository Review
05
Go Live
10
Results & Impact
Fully Digital Workflows

All paper-based work orders eliminated
Real-time mobile access to requests and labor entry
Significant reduction in administrative overhead
Statewide visibility into reactive and preventative work order data
Integrations into the state payroll and accounting systems
Data-Driven Capital Planning
Condition assessment deficiencies data drives project prioritization
Leadership can pull reports showing deficiencies by region, asset type, and cost
Ability to justify funding requests with complete data

Complete Maintenance Management Visibility
Track all required reactive and preventive maintenance work
Identify gaps in completion
Demonstrate staffing and budgeting needs to leadership
Highlight risks and deferred maintenance
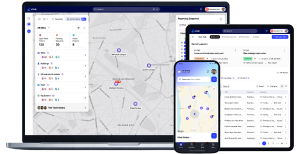
A Feature Collaboration: The GIS Heat Map Dashboard
Leadership needed map-based views of statewide data. The result:
Co-developed by the state agency and zLink, now being rolled out to all zLink clients
Became a tool used in leadership presentations
A True System of Record
For the first time, the state agency can pull historical data on any building instantly — work done, cost history, deficiencies, leases, drawings, documents, and more.
“Itʼs incredibly helpful to have
everything in one system
- work orders, preventive maintenance, condition assessments, deficiencies, and more - all in one place. With zLink, we can
pull reports, show leadership exactly where we stand,
and
make informed decisions
about how to
prioritize our projects and spend our limited funding.
ˮ
State agency’s zLink administrator
Ready to Transform Your Facilities Operations?
Deep configurability, all the features of an Integrated Workplace Management Software on a truly singular platform, and white-glove support built for complex organizations like yours.
Geoff Hudson, Director of Sales | geoff.hudson@zlinkcorp.com | +1 (919) 730-3611